Teaching Capacity
How effectively do available staffing resources translate into capacity to deliver the curriculum?

GAUGED brings educational, workforce and financial performance together and benchmarks your school against genuinely comparable schools—helping senior leaders and governors identify relative strengths, areas for investigation and the questions that matter.

100 = Peer Median
Begin at the depth that suits you
You do not need to understand the entire GAUGED range to begin. See the position quickly—or take a little longer to understand what may be driving it.
100 = Peer Median
View the headline Indices, peer rankings and quartile positions across educational outcomes, teaching capacity, workforce resilience and financial stewardship.
View the Dashboard →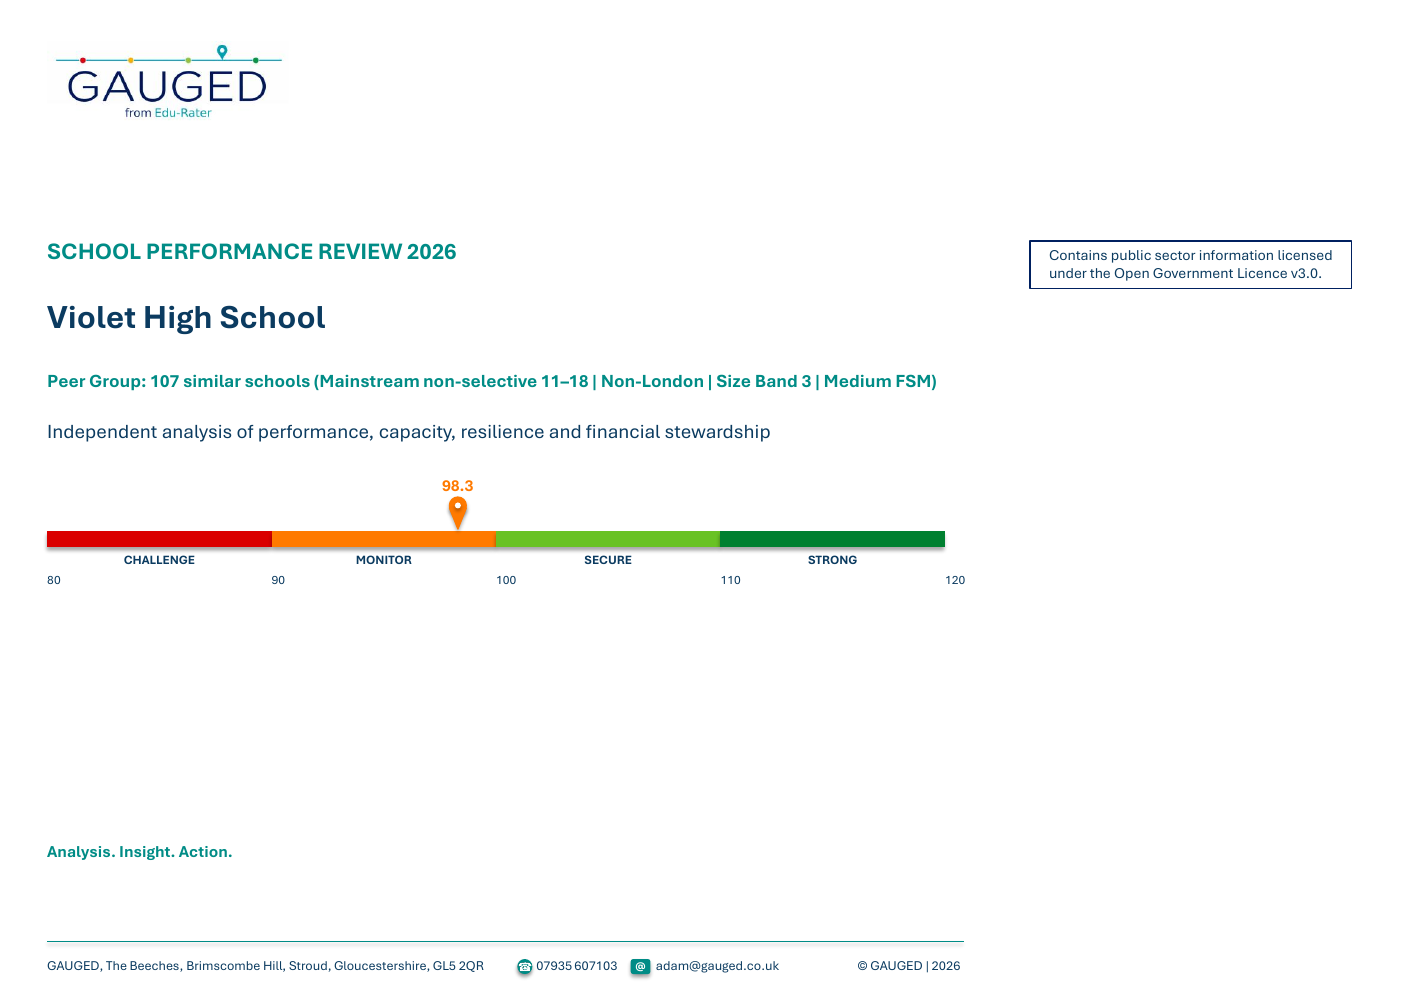
Look beneath the headline Indices to see the actual figures, underlying measures and comparative evidence—and identify the questions worth investigating.
Explore the Performance Review →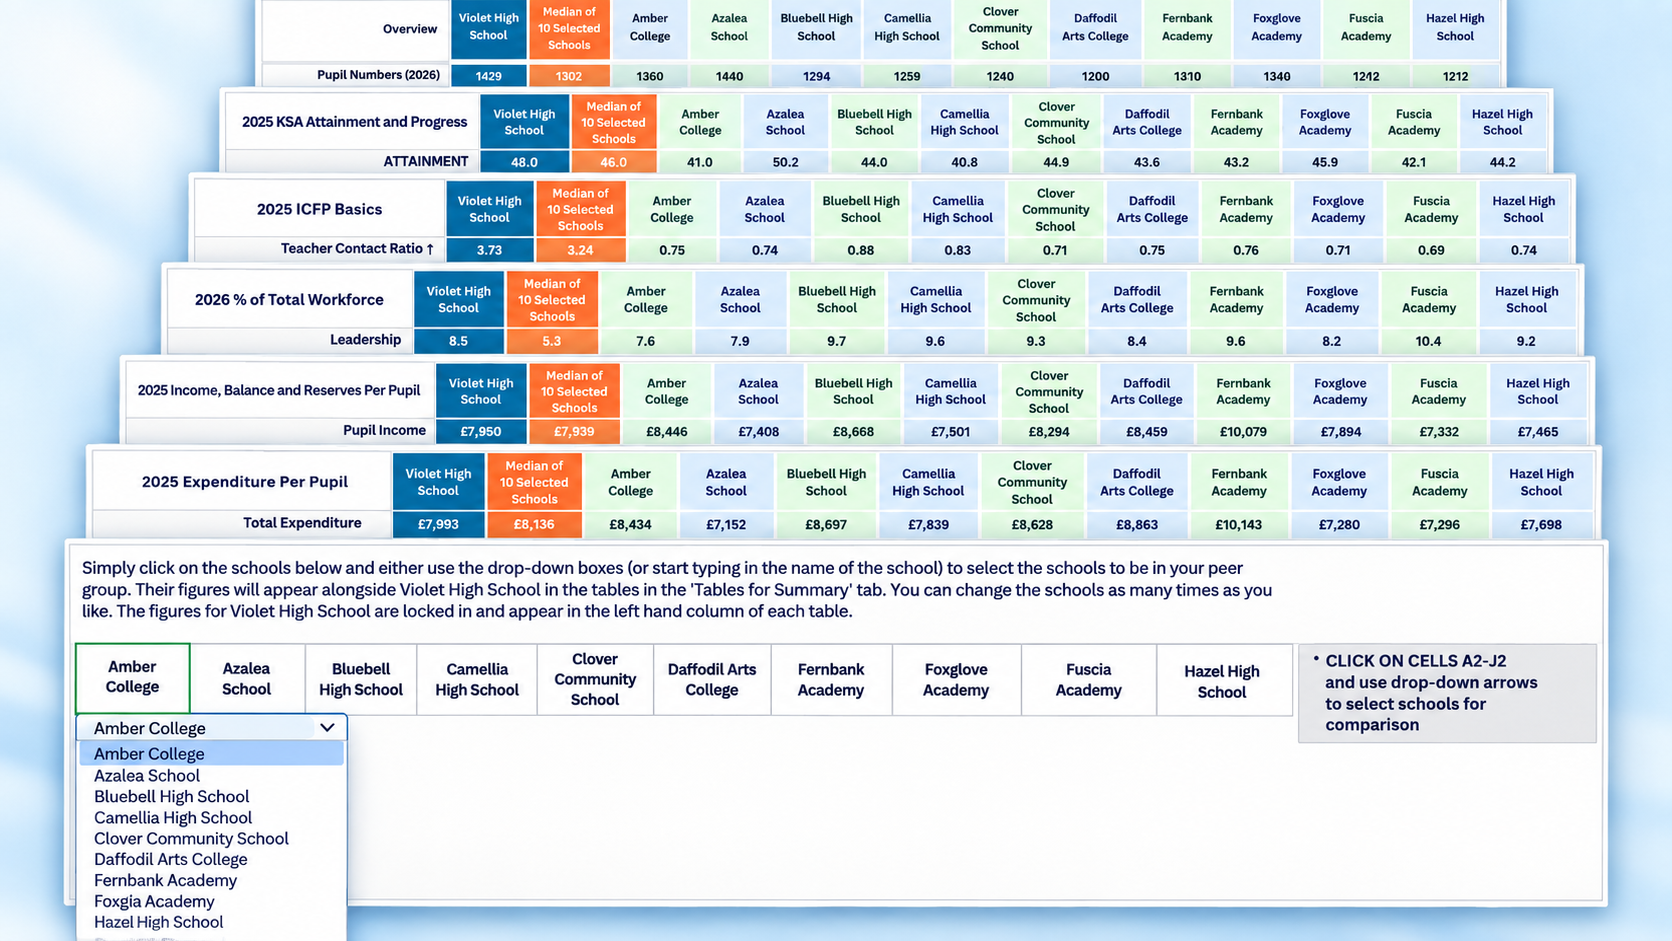
Examine wider peer-group gaps, test possible changes and build bespoke comparisons with the Scenario Planner and Interactive Spreadsheet.
Explore the analytical tools →See. Understand. Investigate. Choose the depth you need now. You can always go further.
The management question
Published data is plentiful. The challenge is understanding whether a result is typical for a school like yours, how the different parts of performance relate and where closer investigation may be worthwhile.
How effectively do available staffing resources translate into capacity to deliver the curriculum?
Is that capacity stable, sustainable and supported by a resilient workforce?
How do financial position and resource deployment compare with similar schools?
What are pupils achieving, considered alongside the resources supporting delivery?
One approach, seven academy products and a Trust-wide view
Each GAUGED product uses the same comparative framework: relevant peers, meaningful measures and management information that supports professional judgement.
A concise visual overview of your school’s comparative position.
FREE →MATA free headline view across a MAT, with every academy assessed against its own appropriate peer group.
FREE from GAUGED →02A one-page summary of your Indices, peer rankings and quartile or decile positions.
£25 →03Structured analysis of the factors underlying the headline position.
£100 →04See the gaps between your school and its complete peer group.
£75 →05Test how changes in school-specific measures affect comparative position.
£50 →06Direct comparison with schools you consider genuinely relevant.
£75 →07Interrogate schools, measures, tables and charts yourself.
£100 →08A consolidated MAT view showing academy actual figures, Indices, peer rankings and quartile positions.
From £50 →A personalised starting point
Request your school’s 2026 Overview Dashboard, prepared from published data and an appropriate peer group.